
For anyone with overall responsibility for a risk area, the risk overview shows the bigger picture rather than a list of individual assessments.
- Open the risk area and go to the risk overview.
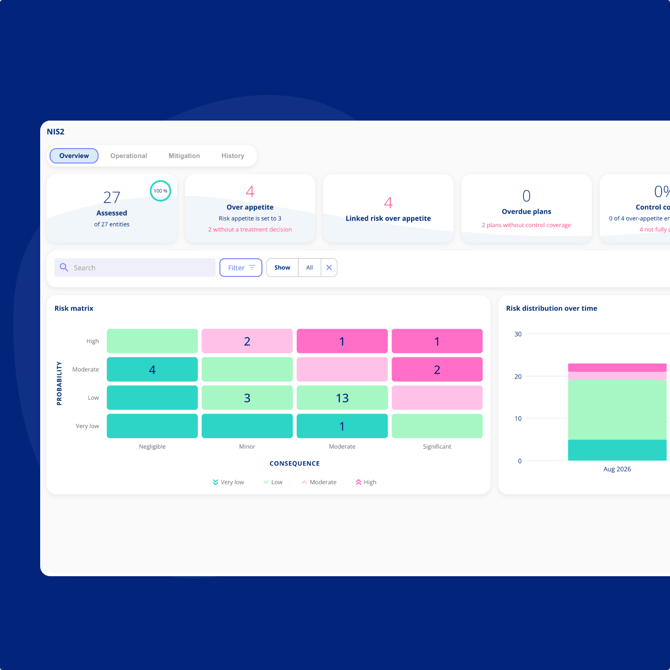
- Read the matrix to see how many entities fall into each combination of consequence and probability. Click the cells to see what entities risk are underneath.
- Check the key figures above it: entities over appetite, linked risks over appetite, and overdue mitigation plans.
- Use the filters to narrow the view, for example to everything over appetite.
Switch between views
The overview can be shown in three ways:
- Current shows the picture as it stands today.
- After mitigation shows what it would look like if every open plan were completed.
- Snapshot shows any earlier point in time exactly as it appeared then.
A chart below the matrix shows how the distribution has developed over time.
Organisational risks in the overview
Risks assessed at organisational level are counted in the overview just as entities are, for example how many scenarios have been assessed and how many sit above appetite. In a risk area that covers both, entities and organisational scenarios are shown separately. See Assess risks at organisational level.