
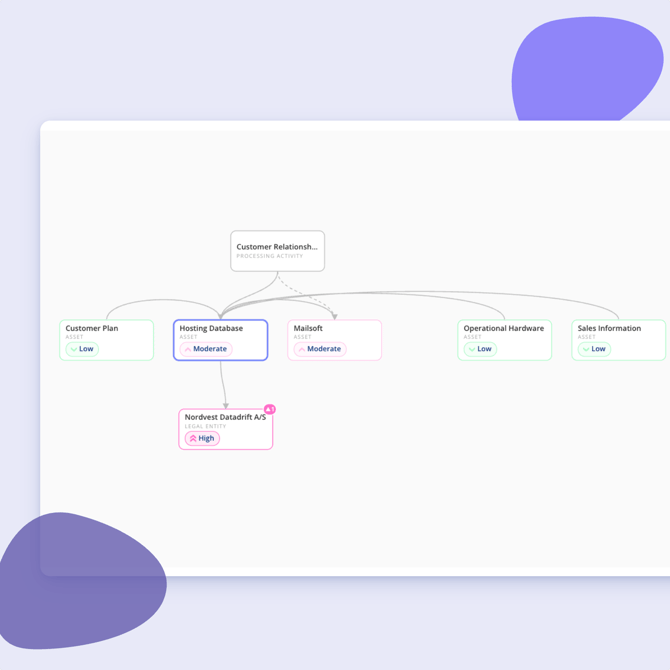
An entity can look low risk on its own while being connected to things that are not. The relationship graph shows how your processes, assets and suppliers are connected, so you can see where risk is inherited from.
- Open the entity you want to look at, for example a processing activity.
- Select the view entity graph button in the top of the overview.
- The entity sits in the centre, with connected entities around it.
- Click a connected node to expand the graph and follow the chain further out.
- Look for nodes marked as being over appetite. These are the sources of inherited risk.
Act on what you find
- Click through from the graph to the entity carrying the risk.
- Open its risk assessment.
- Handle it as you would any other risk, by accepting it, avoiding it or creating a mitigation plan.
The number of linked risks over appetite is also shown as a key figure in the risk area overview, so you do not have to open the graph to know there is something to look at.